Take the following code snippet as a starting point. It loads the NUTS regions of Europe, the power plant dataset, and a shapefile for the Danish Natura2000 natural protection areas.
import cartopy
import pandas as pd
import geopandas as gpd
import cartopy.crs as ccrs
import matplotlib.pyplot as plt

url = "https://tubcloud.tu-berlin.de/s/RHZJrN8Dnfn26nr/download/NUTS_RG_10M_2021_4326.geojson"
nuts = gpd.read_file(url)

fn = "https://raw.githubusercontent.com/PyPSA/powerplantmatching/master/powerplants.csv"
df = pd.read_csv(fn, index_col=0)
geometry = gpd.points_from_xy(df["lon"], df["lat"])
ppl = gpd.GeoDataFrame(df, geometry=geometry, crs=4326)

url = "https://tubcloud.tu-berlin.de/s/mEpdmgBtmMbyjAr/download/Natura2000_end2021-DK.gpkg"
natura = gpd.read_file(url)
Notebook Cell
import cartopy
import pandas as pd
import geopandas as gpd
import cartopy.crs as ccrs
import matplotlib.pyplot as plt

url = "https://tubcloud.tu-berlin.de/s/RHZJrN8Dnfn26nr/download/NUTS_RG_10M_2021_4326.geojson"
nuts = gpd.read_file(url)

fn = "https://raw.githubusercontent.com/PyPSA/powerplantmatching/master/powerplants.csv"
df = pd.read_csv(fn, index_col=0)
geometry = gpd.points_from_xy(df["lon"], df["lat"])
ppl = gpd.GeoDataFrame(df, geometry=geometry, crs=4326)

url = "https://tubcloud.tu-berlin.de/s/mEpdmgBtmMbyjAr/download/Natura2000_end2021-DK.gpkg"
natura = gpd.read_file(url)
Task 1: Identify the coordinate reference system of the natura GeoDataFrame.
Notebook Cell
natura.crs<Projected CRS: EPSG:3035>
Name: ETRS89-extended / LAEA Europe
Axis Info [cartesian]:
- Y[north]: Northing (metre)
- X[east]: Easting (metre)
Area of Use:
- name: Europe - European Union (EU) countries and candidates. Europe - onshore and offshore: Albania; Andorra; Austria; Belgium; Bosnia and Herzegovina; Bulgaria; Croatia; Cyprus; Czechia; Denmark; Estonia; Faroe Islands; Finland; France; Germany; Gibraltar; Greece; Hungary; Iceland; Ireland; Italy; Kosovo; Latvia; Liechtenstein; Lithuania; Luxembourg; Malta; Monaco; Montenegro; Netherlands; North Macedonia; Norway including Svalbard and Jan Mayen; Poland; Portugal including Madeira and Azores; Romania; San Marino; Serbia; Slovakia; Slovenia; Spain including Canary Islands; Sweden; Switzerland; Türkiye (Turkey); United Kingdom (UK) including Channel Islands and Isle of Man; Vatican City State.
- bounds: (-35.58, 24.6, 44.83, 84.73)
Coordinate Operation:
- name: Europe Equal Area 2001
- method: Lambert Azimuthal Equal Area
Datum: European Terrestrial Reference System 1989 ensemble
- Ellipsoid: GRS 1980
- Prime Meridian: GreenwichTask 2: Plot the natura GeoDataFrame on a map without transforming its CRS. Use cartopy for setting the projection of the figure and add coastlines and borders.
Notebook Cell
fig = plt.figure()
ax = plt.axes(projection=ccrs.epsg(3035))
natura.plot(ax=ax)
ax.coastlines()
ax.add_feature(cartopy.feature.BORDERS);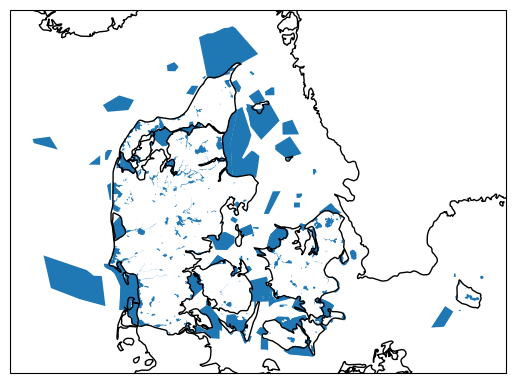
Task 3: Identify the name of the largest protected area in the natura GeoDataFrame.
Notebook Cell
i = natura.area.idxmax()
natura.loc[i, "SITENAME"]
'Skagens Gren og Skagerak'Task 4: What is the total protection area in square kilometers.
Notebook Cell
natura.dissolve().area.iloc[0] / 1e6np.float64(22646.37570082661)Task 5: The natura GeoDataFrame has a column SITETYPE that indicates the type of protected area. Calculate the total area for each type of protected area (again in square kilometers).
Notebook Cell
natura.dissolve("SITETYPE").area / 1e6SITETYPE
A 11751.536465
B 16632.563873
C 3037.541735
dtype: float64Task 6: By how much (in percent) would the total area of protected areas increase if a buffer of 1 km around each protected area were also protected?
Notebook Cell
original_area = natura.dissolve().area.div(1e6).iloc[0]Notebook Cell
expanded_area = (
    gpd.GeoDataFrame(geometry=natura.buffer(1000)).dissolve().area.div(1e6).iloc[0]
)
Notebook Cell
expanded_area / original_area * 100 - 100np.float64(46.43473733258506)Task 7: List the power plants that are located within protected areas. How many power plants are located within protected areas? Use the .sjoin() function. Check the result by plotting these power plants on top of the protected areas.
Notebook Cell
p = ppl.to_crs(natura.crs).sjoin(natura)
pNotebook Cell
len(p)4Notebook Cell
ax = natura.plot()
p.plot(ax=ax, color="red", markersize=5);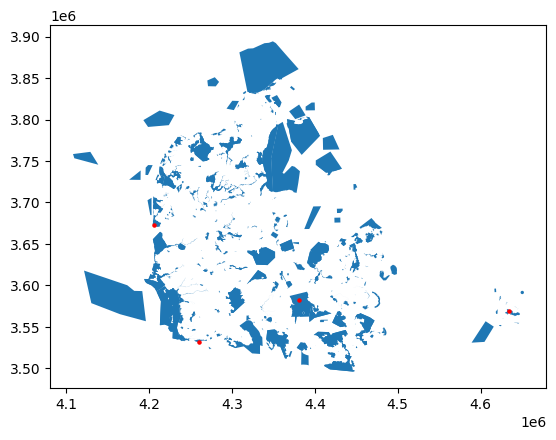
Task 8 (advanced): What fraction of the natural protection area is located offshore? Use set operations with the .overlay() function and the NUTS regions GeoDataFrame.
Notebook Cell
dk = nuts.query("LEVL_CODE == 0 and CNTR_CODE == 'DK'")Notebook Cell
overlay = gpd.overlay(natura, dk.to_crs(3035))Notebook Cell
onshore = overlay.dissolve().area.div(1e6).iloc[0]
total = natura.dissolve().area.div(1e6).iloc[0]
Notebook Cell
onshore / total * 100np.float64(18.630060811760643)